Agent Playback
In the Agent Analyze board, you can view the scenario using the same playback controls available in the Scenario Playback board, including following other Agents and changing to 2D views. You will find that the Body Frame Vectors and Fields of View have been rendered for the selected Agent, each of which can be toggled using the buttons at the top left. Unlike in the Scenario Playback board, the default view here follows the Agent that you are analyzing. This can be toggled using the Follow S/C button at the top left of the playback window.
The playback window can be accessed under each subsystem in the Navigation Bar; these pages differ in that each contains a dynamic widget which plays back subsystem data as the simulation progresses.
GNC
The GNC playback widget shows the state of the attitude control system (ACS). This includes the sensors and their keep-in/out FoVs, the sensors' dependent state determination algorithms, those algorithms' dependent attitude control algorithms, and those algorithms' controlled actuators.
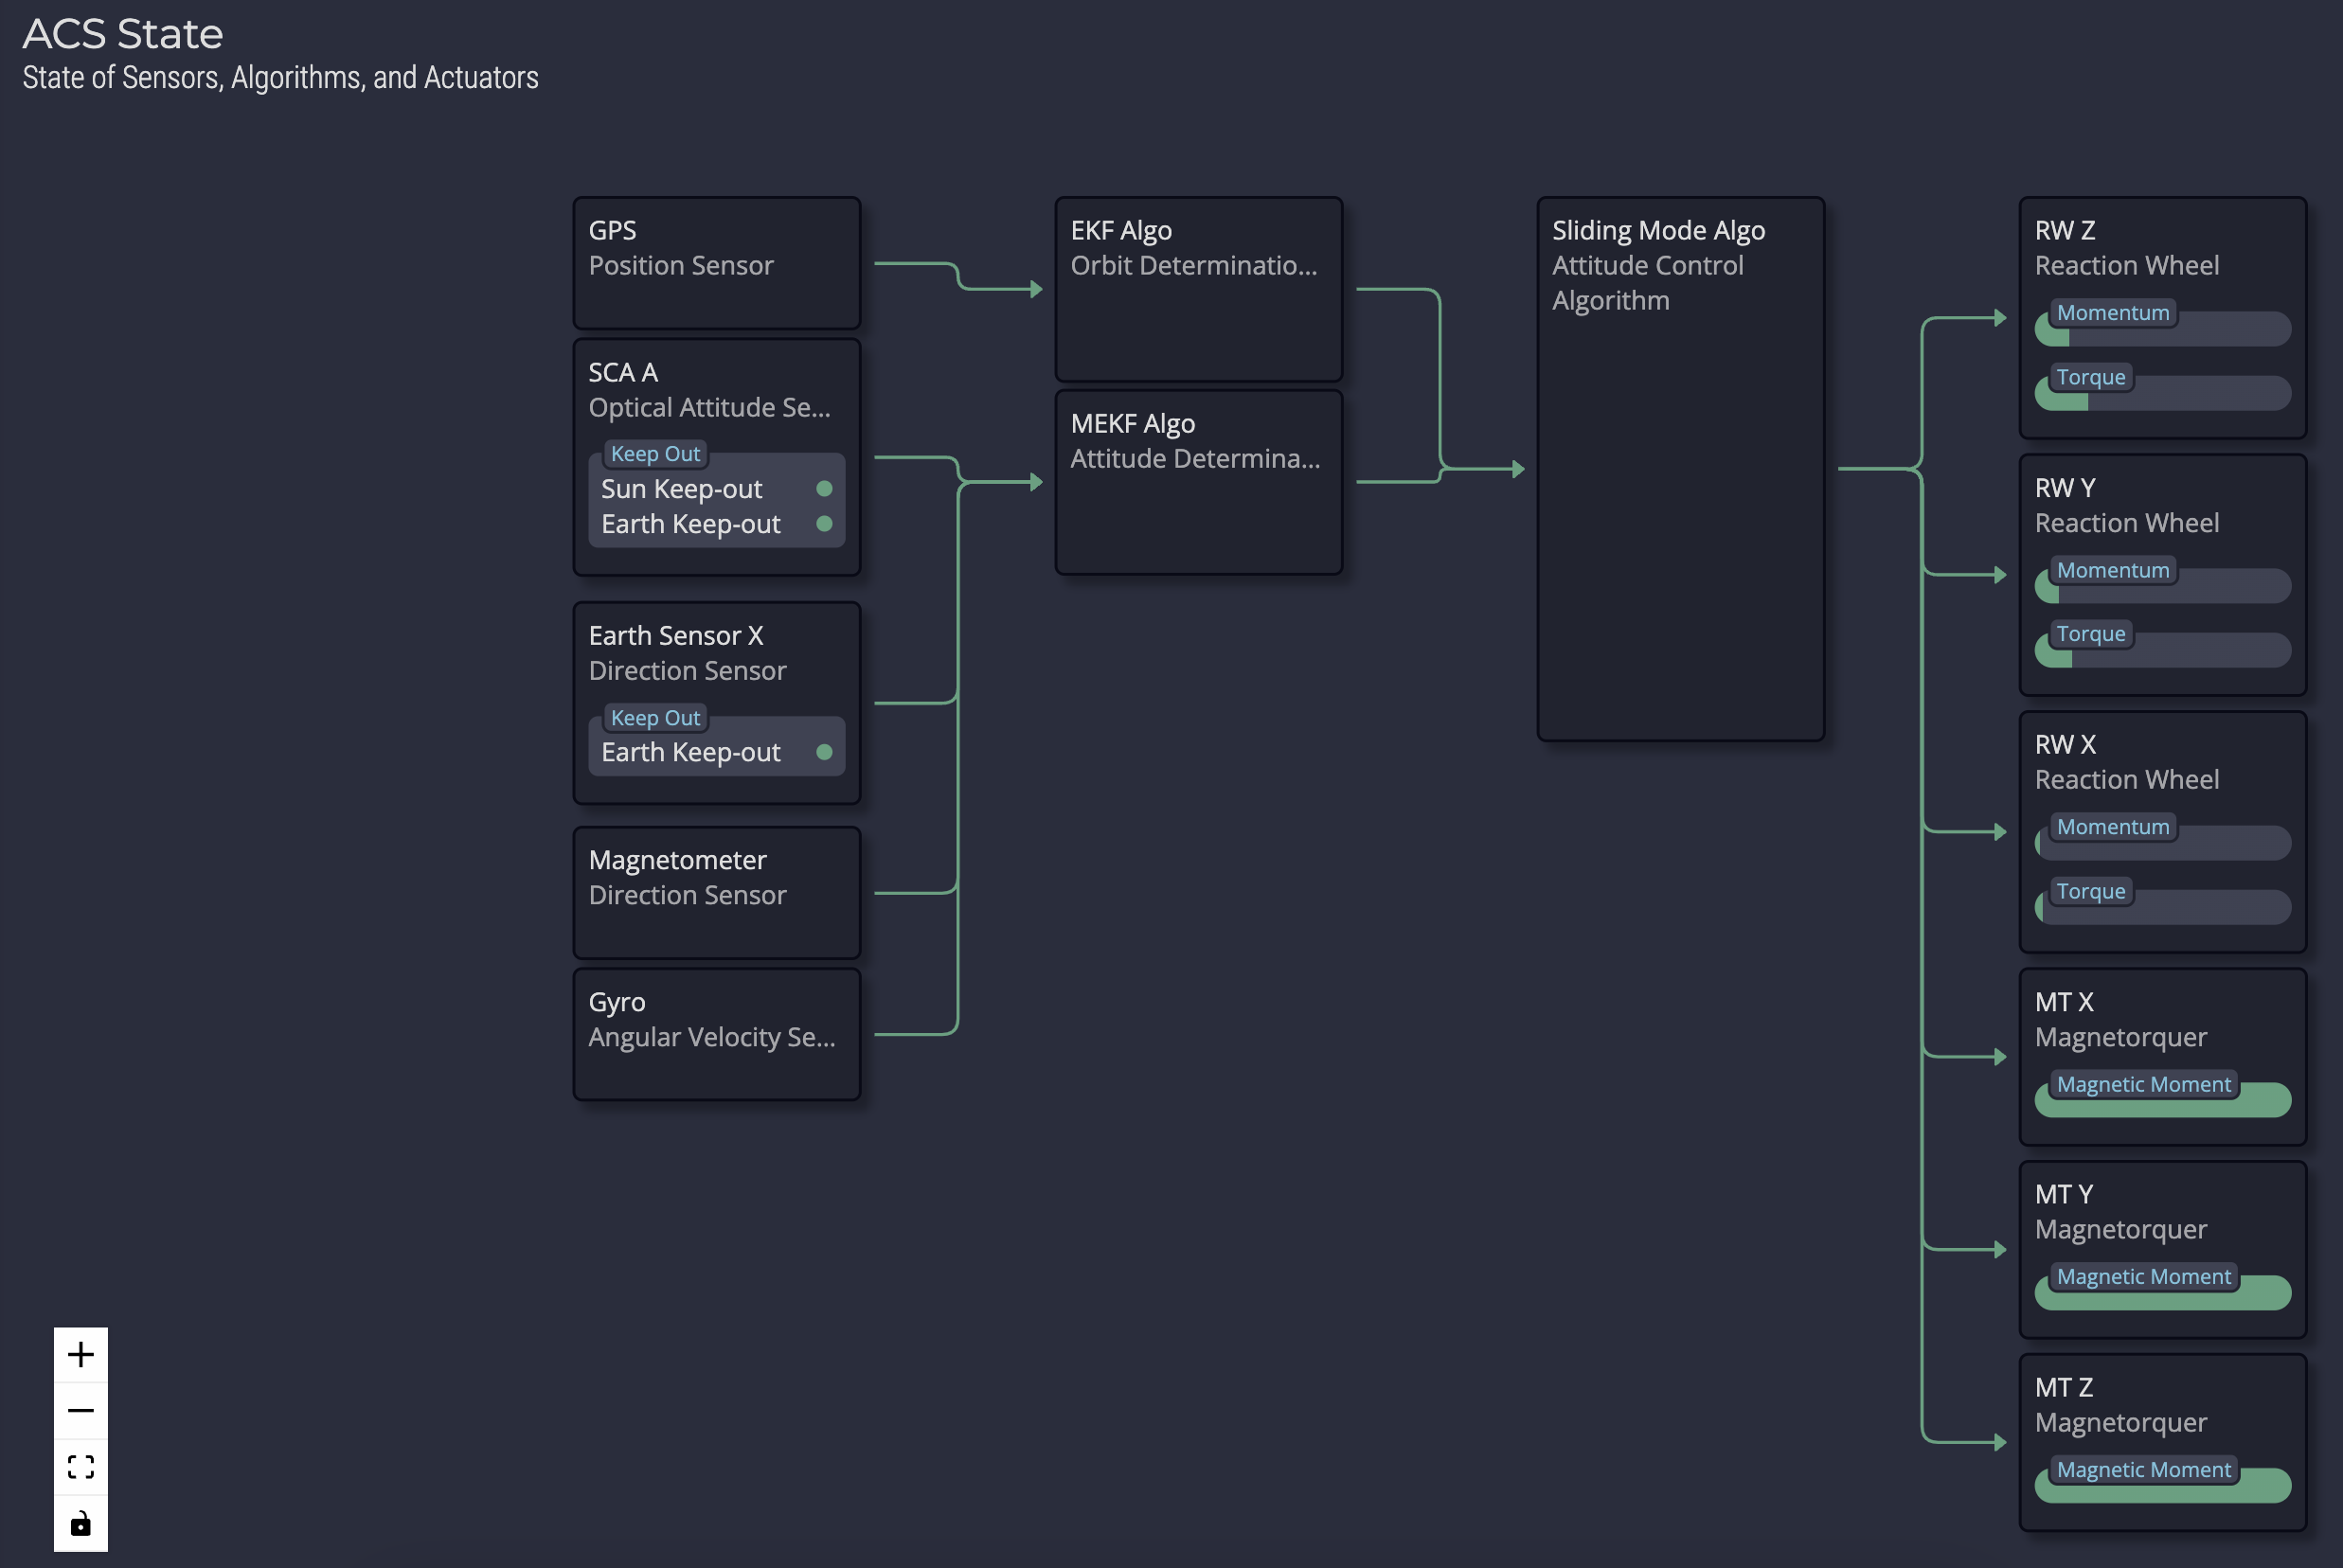
GNC Playback Widget
Command & Control
The Command & Control playback widget shows the active Routines along with pointing and timing information in the left panel. The right panel shows the compliance of each Routine, and the compliance of each associated condition will drop down if you click the caret.
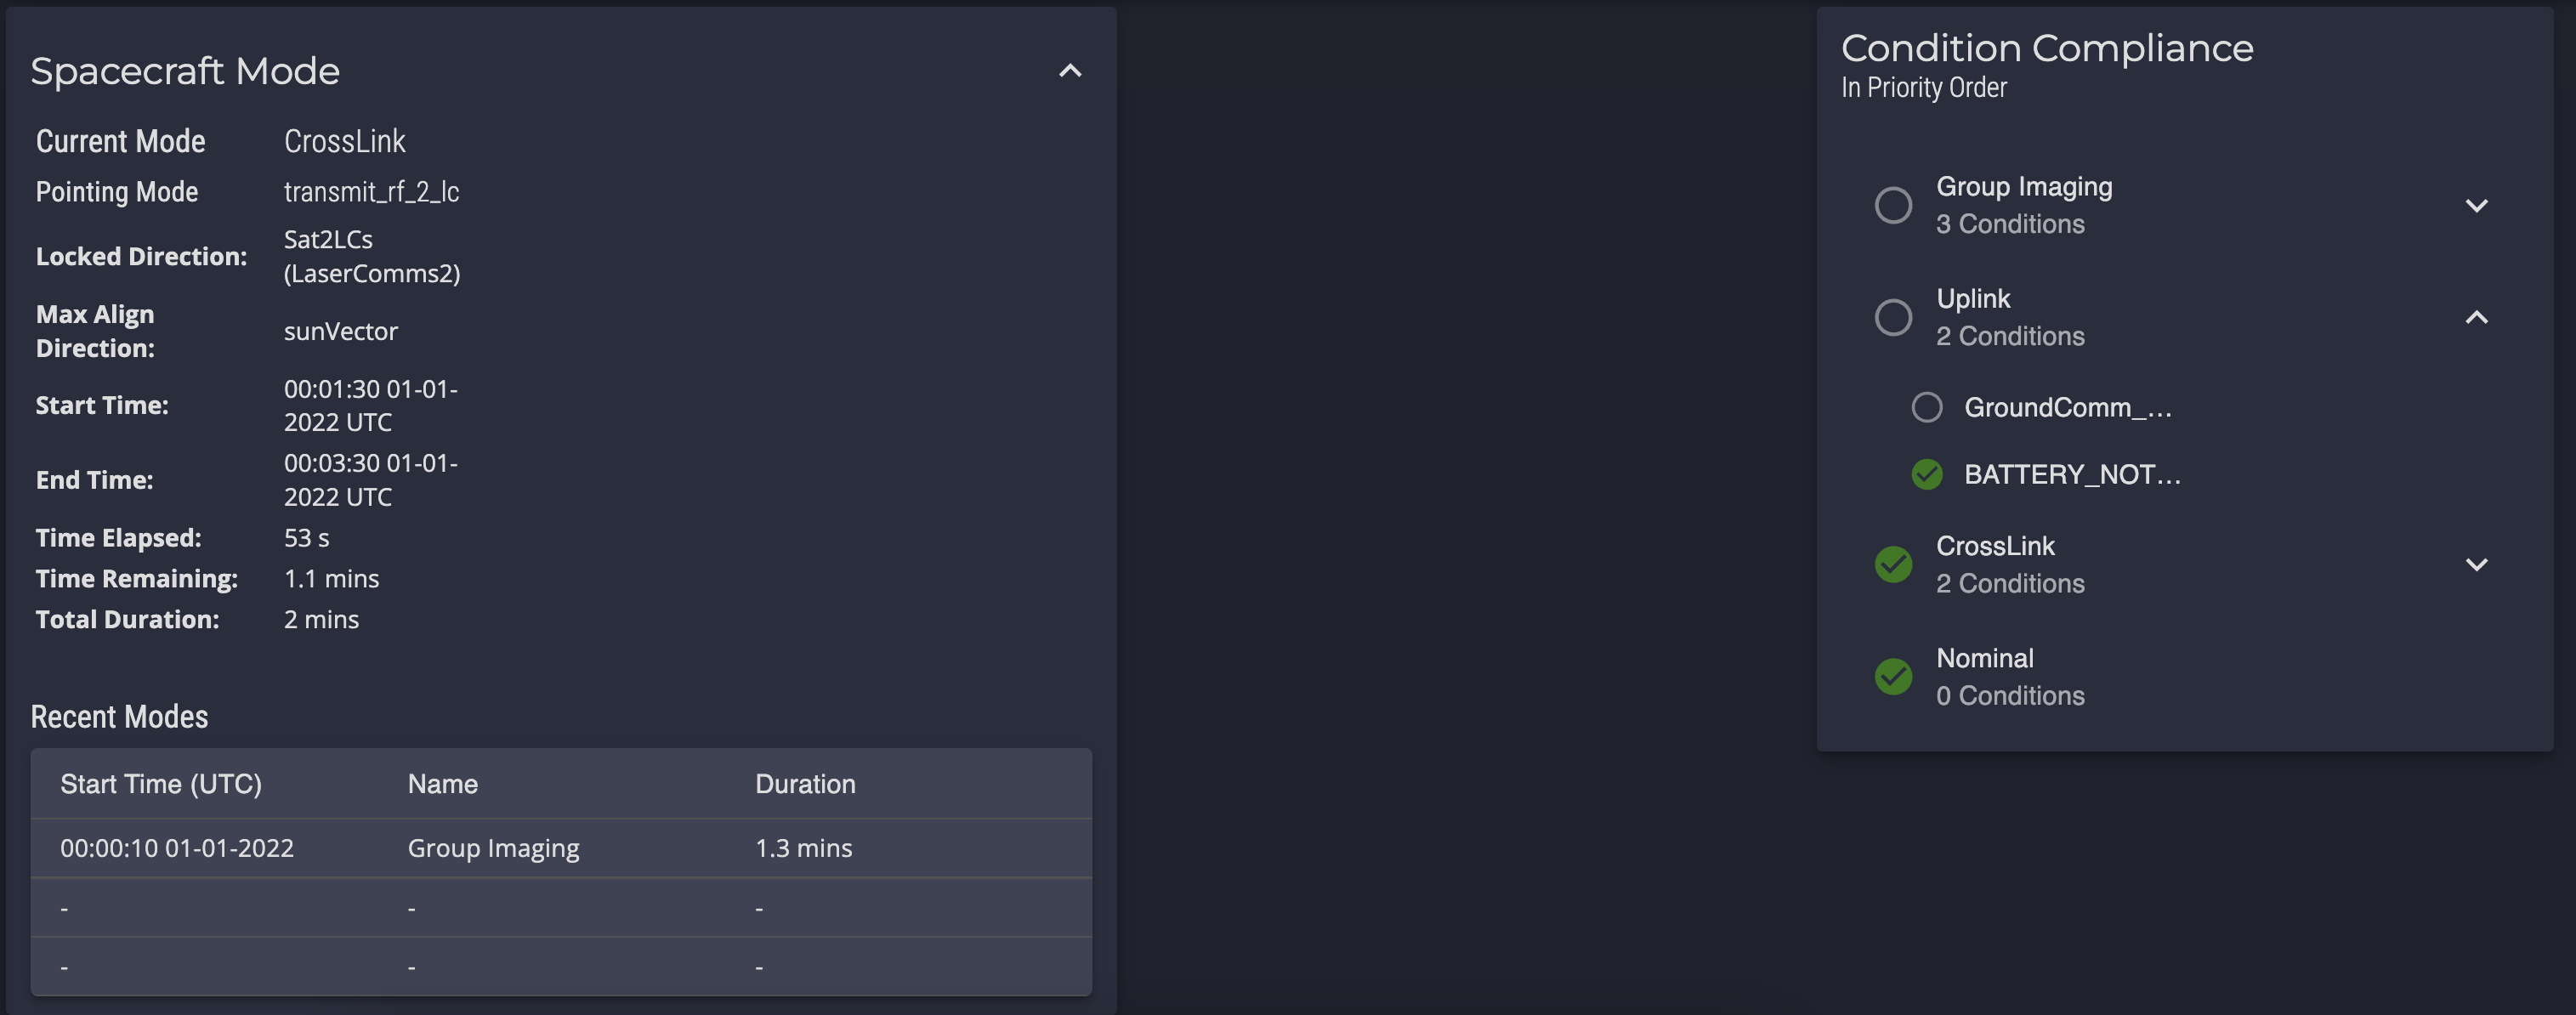
Command & Control Playback Widget
Data Handling
All 3D playback views render lines to indicate the communication interactions between agents in the simulation. Communications lines in the 3D view visualize the status of the communication link between two agents. A gray line between two agents indicates that a link is set to active and a connection is possible, but no data is currently flowing. A green line indicates that data is actively flowing between the two agents.
If no line is present when an external interface is active, it means that a connection is not currently possible between the two agents. This can happen if the field of view constraints are not met for the transmitter (passive communications) or both the transmitter and the receiver (cooperative communications).
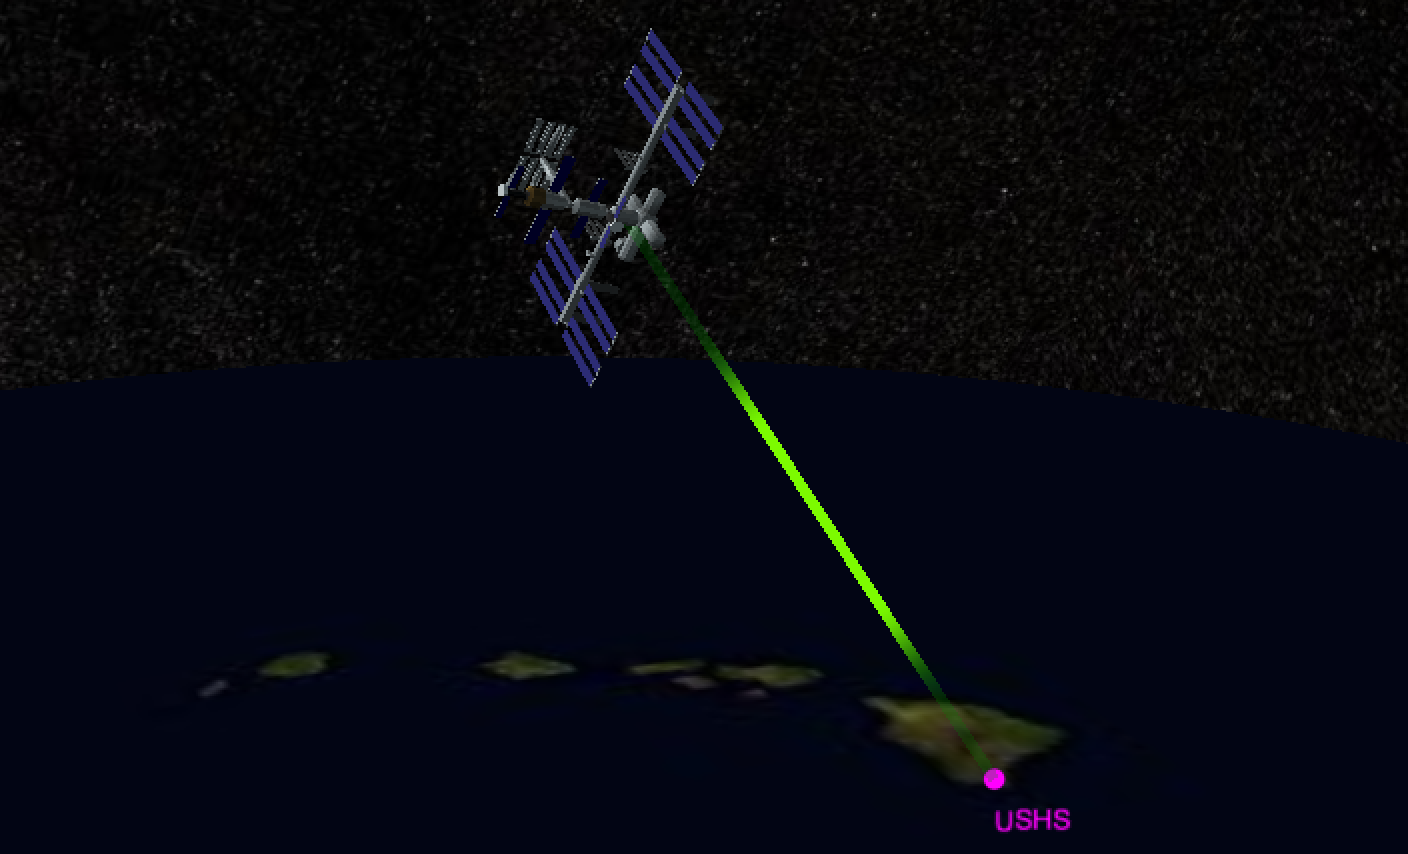
Communications Playback in the 3D View
Power
The Power playback widget shows the active Routines panel from the Command & Control playback widget along with a Sankey diagram showing the flow of power through the spacecraft. The diagram displays production from the panels feeding into the arrays and power processor along with consumption flowing out of the processors into the subsystems and their constituent components.
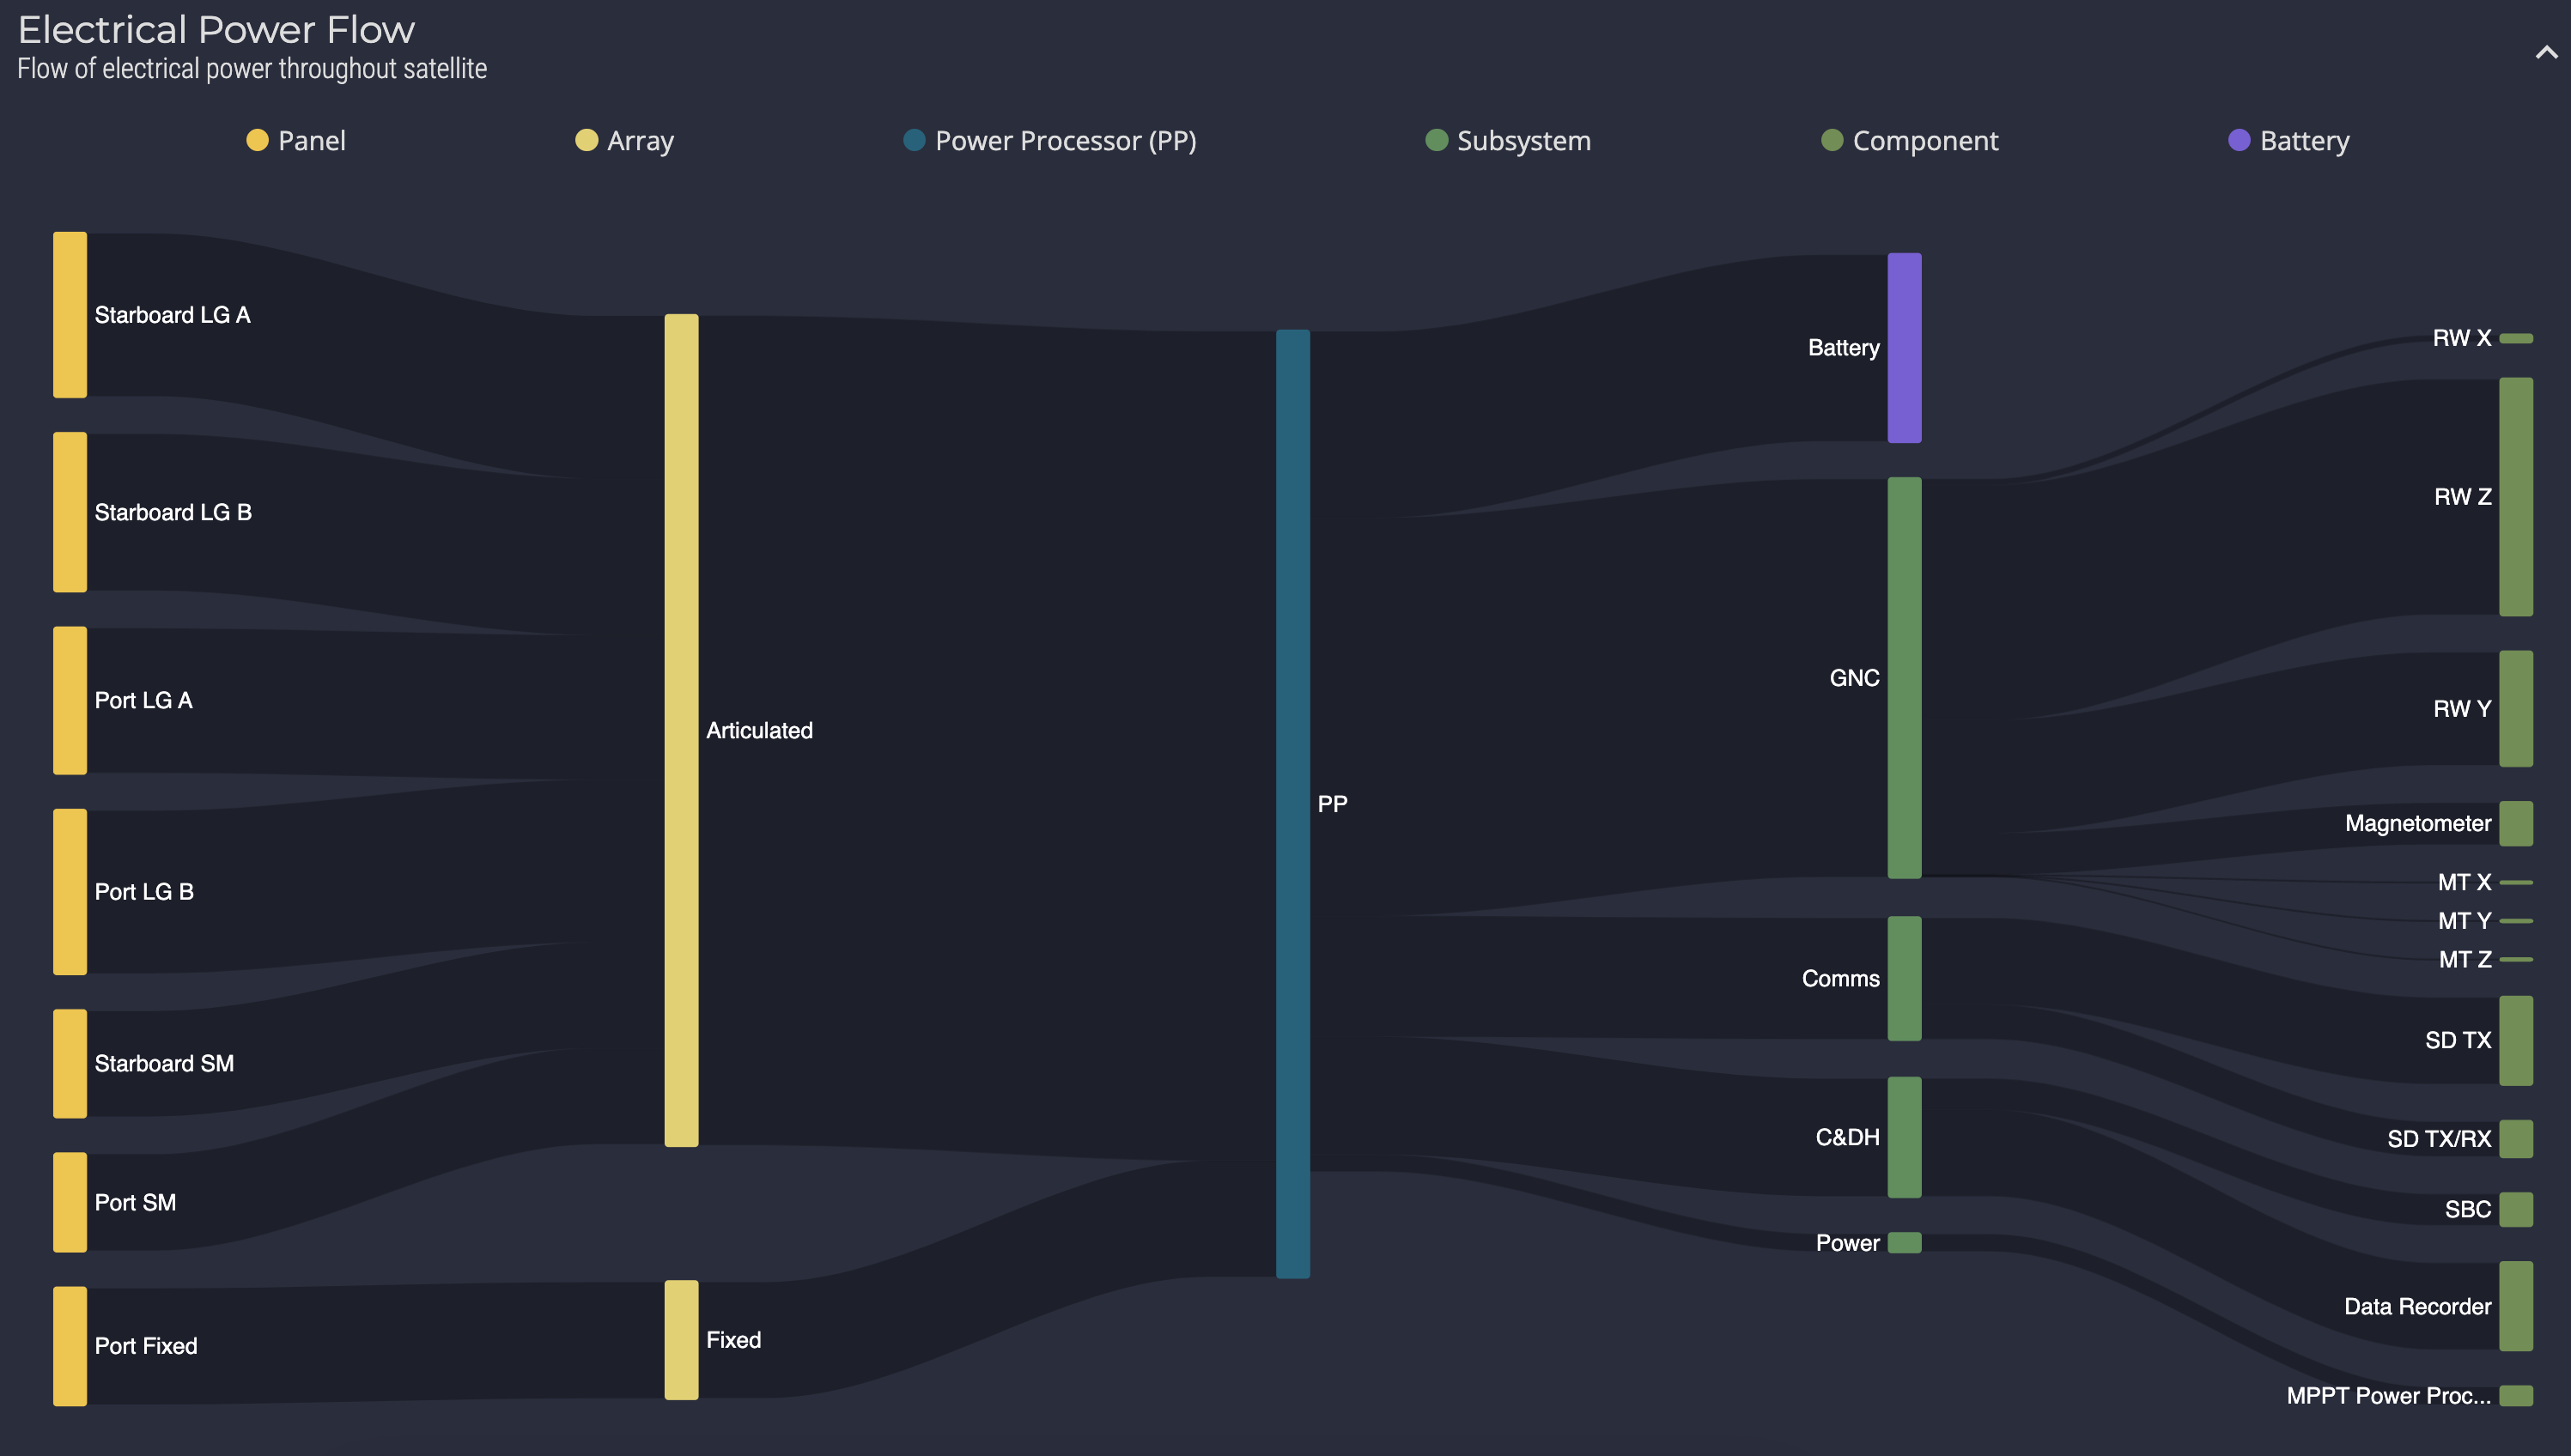
Power Sankey Diagram
Thermal
The Thermal playback widget shows the thermal network of components and surfaces of the spacecraft. The color of the node represents the temperature, and the bounds of the color scaling can be adjusted using the Temperature Range slider. This widget also includes a Sankey diagram which shows the total heat flow in and out of the spacecraft.
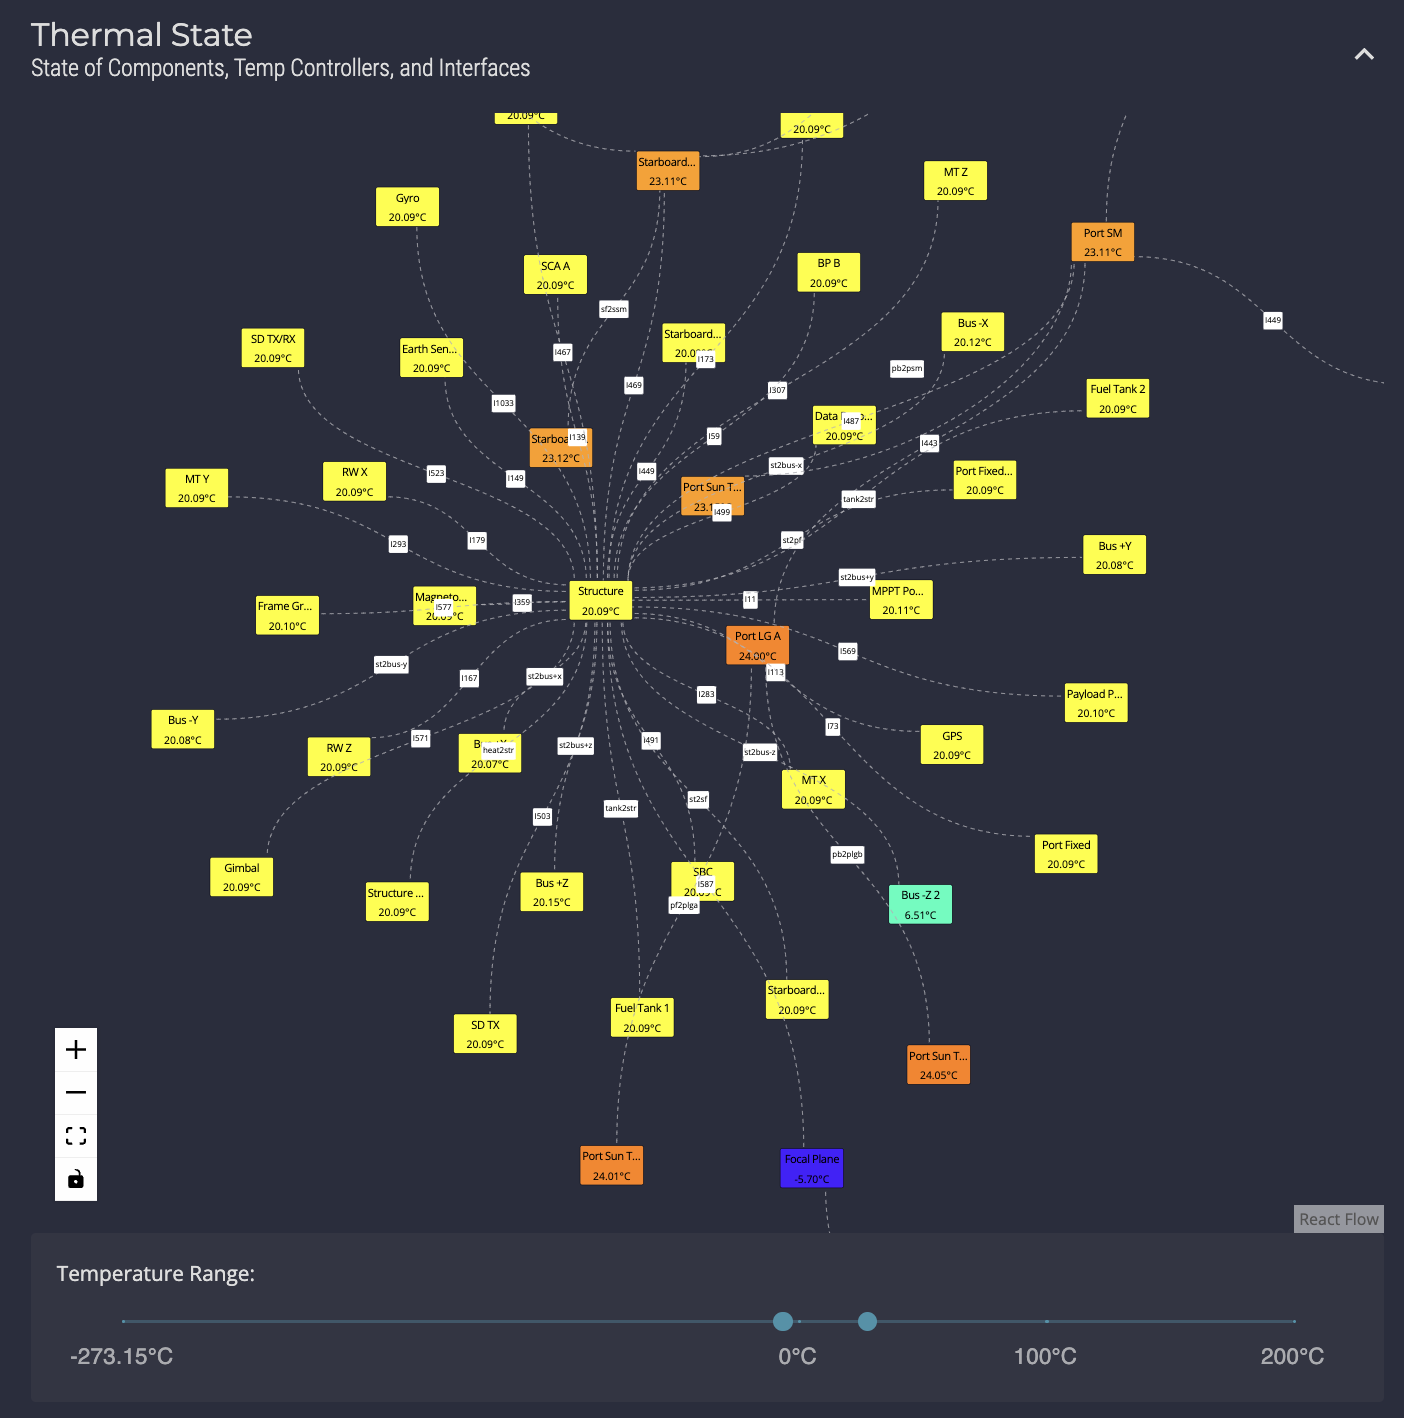
Spacecraft Thermal Network